Test for Enriched Sepsis Gene Sets
Overview
SeptiSearch provides an implementation of GSVA, which will examine the expression of its curated gene sets within user-supplied expression data produced by technologies such as RNA-Seq or microarrays. Each sample within your dataset is assigned an enrichment score for each gene set, which can be positive or negative depending on the expression level of the genes in a given sample.
Getting started
There are two options for submitting data to be analyzed with GSVA:
- Included with SeptiSearch is an example dataset based on microarray data from GSE65682, accessible via the “Load example data” button
- Upload your own expression dataset to analyze
If you’d like to submit your own data for GSVA, the expression component needs to meet the following criteria:
- The data must in a plain text, comma-delimited (CSV) file
- The first column must contain Ensembl gene IDs
- The remaining columns should contain samples, each with a unique name
- Expression values within the matrix should be transformed/normalized
- We provide a link to information on the Variance Stabilized Transformation (VST), which is often suitable for RNA-Seq data, but other methods may also be used, e.g. if you’re working with microarrary data
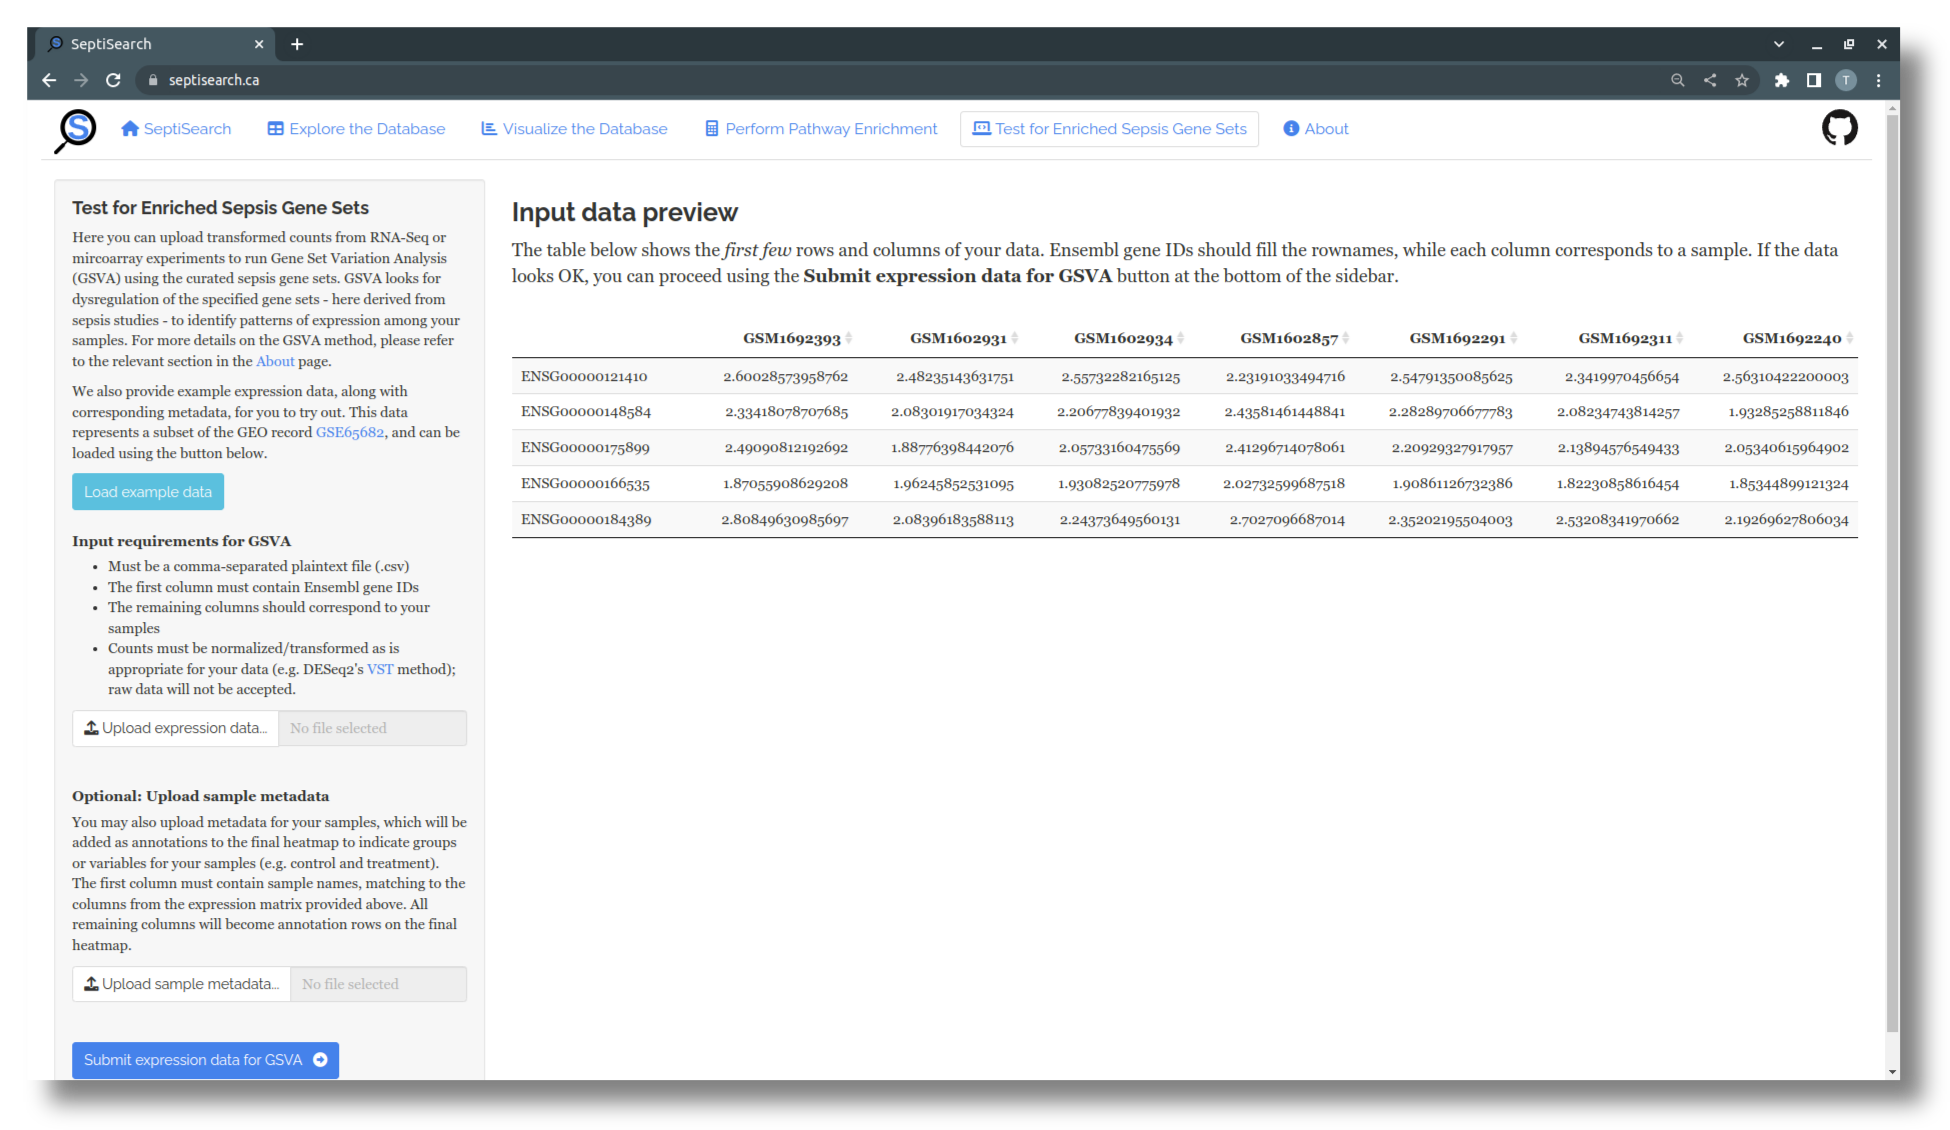
Whichever option you choose, a preview of the uploaded data will be displayed to confirm the data has been processed correctly.
Uploading metadata along with expression data
While you can submit only the expression data for GSVA, it’s recommended to also include metadata (e.g. sample groupings) to make the final heatmap more informative. While the example dataset already includes some associated metadata, you’ll need to supply your own when using your expression data. This metadata must meet a few requirements:
- Your metadata must be in a plain text, comma-delimited (CSV) file
- The first column should contain the sample names, which must match the sample names (i.e. column names) from your expression data
- Any missing, extra, or non-matching sample names will cause an error, and this matching is case-sensitive
- All remaining columns will be treated as variables or traits of the samples, e.g. disease status, severity, mortality, etc.
Viewing & saving your results
Once you’ve loaded the example data, or uploaded your expression data alone or with metadata, select “Submit expression data for GSVA” to run the analysis and view the results, which include a summary table and heatmap.
Depending on how many samples your data contains, running GSVA may take up to 30 seconds to complete; please be patient!
The top table contains a brief summary of your results, indicating for each gene set the total and shareed number of genes, and the title of the associated publication. More detailed explanations of all columns can be viewed by hovering over the column names with your cursor.
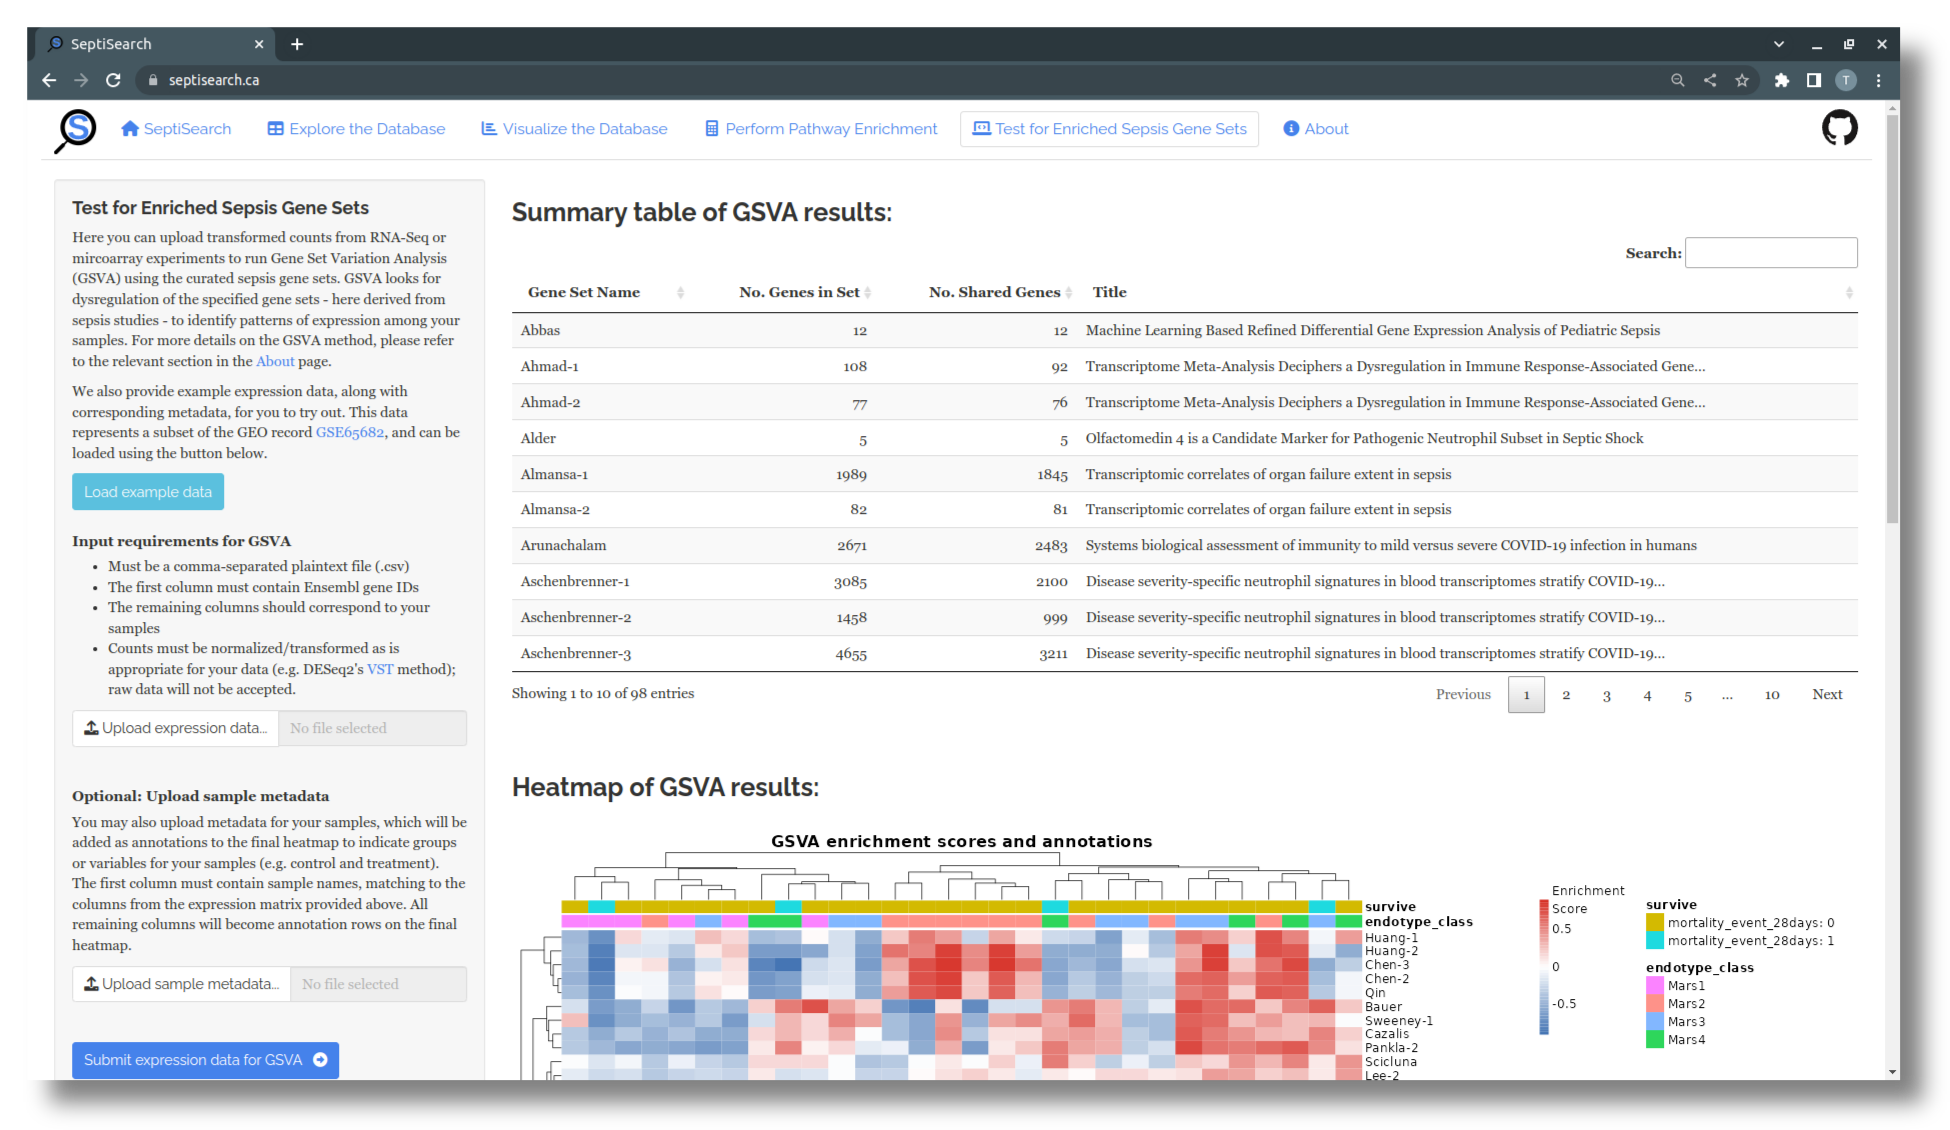
A heatmap is automatically generated to visualize the GSVA results. Columns correspond to samples, while each row represents a gene set in SeptiSearch. The central area of the heatmap displays the enrichment score for each sample/gene set combination, indicating the level of expression of the constituent genes in a given sample. This score can be positive (red) or negative (blue), and ranges from one to negative one.
A full results table can be downloaded with the button at the bottom of the sidebar, and the image can be saved by right-clicking on it and selecting “Save Image…” from the context menu.